
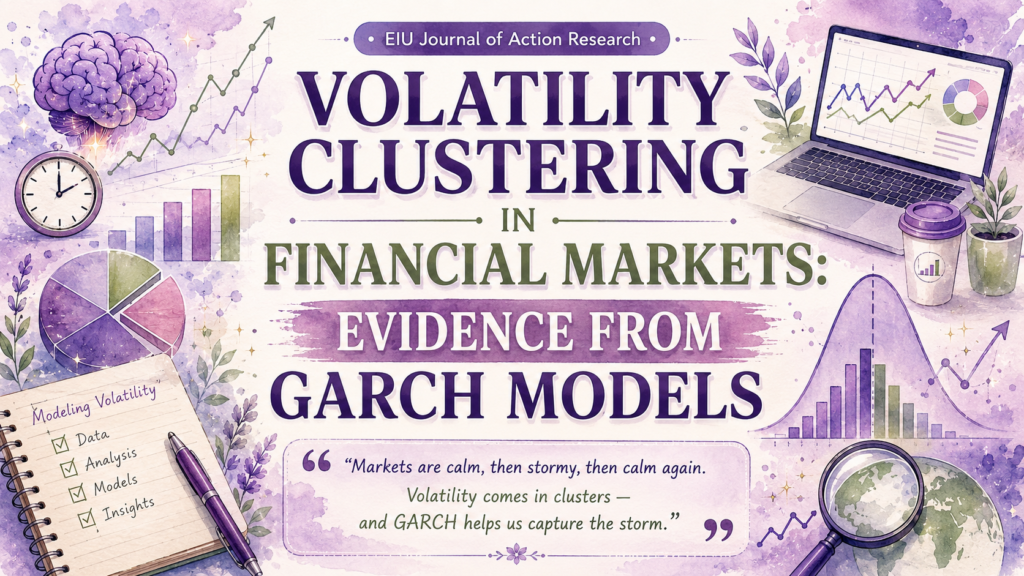
 Poster
This study investigates volatility clustering in financial markets and evaluates whether GARCH models effectively capture the time-varying nature of market volatility. Using 4,030 daily observations of S&P 500 Index returns from 2010 to 2026, the study examines return dynamics through autocorrelation and partial autocorrelation analysis, squared-return dependence, and the ARCH Lagrange Multiplier test. The results provide strong evidence of volatility clustering and significant ARCH effects, with the ARCH LM test producing an F-statistic of 15.73 and a p-value below 0.001. A GARCH(1,1) model is estimated to characterize conditional volatility. The estimated persistence, α + β = 0.977, indicates that volatility shocks are highly persistent and take considerable time to dissipate. Conditional volatility analysis further identifies recurring periods of elevated market risk. The findings demonstrate the usefulness of GARCH modelling for measuring and forecasting financial-market volatility, with implications for Value-at-Risk, portfolio management, derivatives pricing, and risk-management decisions.
Key Words: Volatility clustering; GARCH(1,1); financial markets; S&P 500; conditional volatility; ARCH effects; volatility persistence; risk management; time-varying volatility
Scroll to read the preview. Download for the complete document.
Engle, R. F. (1982). Autoregressive Conditional Heteroskedasticity with Estimates of the Variance of United Kingdom Inflation. Econometrica, 50(4), 987–1007.
Bollerslev, T. (1986). Generalized Autoregressive Conditional Heteroskedasticity. Journal of Econometrics, 31(3), 307–327.
Tsay, R. S. (2010). Analysis of Financial Time Series (3rd ed.). John Wiley & Sons.
Bera, A. K., & Higgins, M. L. (1993). ARCH Models: Properties, Estimation and Testing. Journal of Economic Surveys, 7(4), 305–366.
Yahoo Finance. S&P 500 Historical Data.
Metrics are updated in real time as the article is accessed and downloaded.
Comments
Leave a Comment